


Reading and Interpreting a Psychrometric Chart
Psychrometric charts can be pretty tricky to interpret. Just taking a look at it, you may already be confused. With so many lines and axes, you can get lost trying to follow the chart and find out which line represents which axis.
So why is it important to know how to read a psychrometric chart? Psychrometric charts allow you to track and monitor the physical and thermodynamic properties of gas-vapor mixtures. To correctly read a psychrometric chart, here is a breakdown and visual representation.
Axis
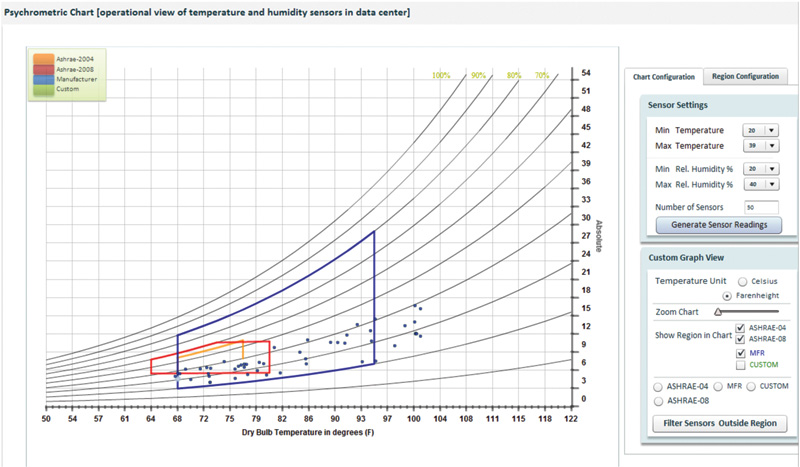
Starting at the basics, there are nine different axes, which are categorized one through nine in the graph. Starting at one, they’re labeled as follows, respectively:
- Dry bulb temperature
- Vapor pressure
- Dew point
- Humidity ratio
- Enthalpy
- Saturation temperature
- Wet bulb temperature
- Specific volume of dry air
- Relative humidity
With this one graph, you will be able to configure nine different vital elements. When given any two points on two different axes, all other components of the graph can be found.
Dry Bulb Temperature
The dry bulb temperature is Point 1 on the graph. This element is measured in degrees Fahrenheit or degrees Celsius, while this specific one is measured in Fahrenheit. Dry bulb temperature is "basically the ambient air temperature."
Vapor Pressure
Vapor pressure is located at Point 2 on the graph. Vapor pressure is measured in units of mercury. For this specific graph, it is measured in inches of mercury.
Dew Point
The dew point is represented on the chart by Point 3. The dew point is measured vertically and usually measured in degrees Fahrenheit or degrees Celsius, on this chart it is measured in Fahrenheit. The dew point is the "temperature at which water vapor starts to condense out of the air."
Humidity Ratio
Point 4 on the graph represents the humidity ratio. The humidity ratio is measured in grains of moisture per pound of dry air. Humidity ratio is expressed by "the ratio between the actual mass of water pressure present in moist air to the mass of the dry air."
Enthalpy
Enthalpy is Point 5 on the chart. Enthalpy is a quantity that is equal to the total heat content of a system. This is measured in BTU (British thermal unit) per pound of dry air.
Saturation Temperature
Point 6 on the graph is saturation temperature. The saturation temperature on this graph is measured in degrees Fahrenheit. Saturation temperature is the temperature at which a liquid boils at a fixed pressure.
Wet Bulb Temperature
The wet bulb temperature is represented on the graph at Point 7. The wet bulb temperature is measured in degrees Fahrenheit. The wet bulb temperature measures "the temperature of the adiabatic saturation."
Specific Volume of Dry Air
Point 8 is labeled as the specific volume of dry air. On this graph, it is measured in cubic feet per pound of dry air. Specific volume of dry air is the total volume of air with no water vapor per cubic feet per pound.
Relative Humidity
Relative humidity is labeled by point 9 on the graph. Relative humidity is "the amount of moisture in the air compared to what the air can 'hold' at that temperature." This is represented by a percentage.
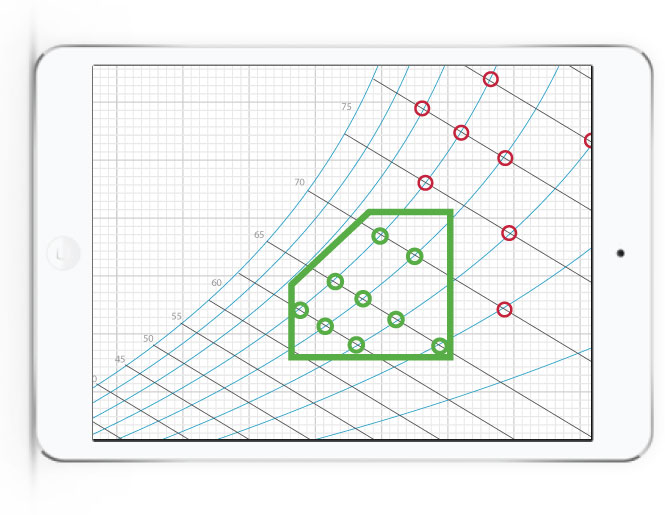
Reading the Measurements
When reading the chart, as long as you have any two elements where the lines cross, you will be able to determine the measure for the rest of the elements. For example, you know that the relative humidity is 30% and the enthalpy is 40 BTU per pound of dry air. The point where these two elements meet is called the "state point." Use the state point as a reference to see where it falls within the other elements of the graph. Since you have the relative humidity and enthalpy measurements, you now can easily find all of the other measurements. Now you want to find the humidity ratio, so you should find the state point. Follow the humidity ratio line all the way to where it intersects the state point and that’s where you can find the measure of humidity ratio, which is 96%.
Reading a psychrometric chart isn’t an easy concept to grasp at first. With time and practice the chart will become more familiar and you will be able to learn more and have a better understanding of psychrometric chart relations to improve your data center.
Click here to learn more about monitoring the environment of your data center.