


Top Data Center Management KPIs to Optimize Space and Power Capacity
More organizations are looking to strategically use data to guide their data center management practices, but few know how to get started or what to track—especially when it comes to capacity, one of the most challenging data center operational constraints.
Data Center Infrastructure Management (DCIM) software is a critical enabling technology for today’s data center managers to maximize the value of their data. Data center business intelligence, visual analytics, and other components integral to DCIM software allow for greater transparency into data center operations, including capacity management. “For organizations adopting DCIM, typically visibility is a starting point,” said Rhonda Ascierto, Research Director, Datacenters & Critical Infrastructure, 451 Research. “Our research shows pretty unequivocally that DCIM can provide the visibility, the planning, the reactivity and proactivity that management needs.”
Ascierto shared these insights and other thoughts as she identified data center Key Performance Indicators (KPIs) and drivers for DCIM deployments during the first segment of our webinar “Top Data Center KPIs to Optimize Capacity Utilization.” She also discussed how more data centers are attempting to integrate and analyze DCIM data, maximize its use, and become increasingly data driven. These efforts reduce risk, support business agility, and improve capacity utilization and planning.
However, without business value, data center metrics and charts have limited utility. “Often, the best KPIs for your business are dictated by your business requirements,” said Ascierto during the webinar. “In my opinion, KPIs to support capacity planning will be critical because the choices for where you can place capacity will continue to grow and become more dynamic.”
Following Ascierto’s discussion of data center KPIs and how organizations can make the most of their DCIM data, Sunbird’s own Samer Nassoura, DCIM Solution Architect, shared real-world examples of data center business intelligence charts and how to interact with the data for specific use cases. Nassoura was joined by Joseph Keena, Data Center Operations, University of Florida Health Shands. Responsible for data center day-to-day operations as well as spearheading the implementation of new technologies, Keena shared his own experience with the practical applications of these charts and metrics.
With the diverse perspectives shared during the webinar, attendees gained real-world, practical tips from experts who understand using DCIM for smarter, more effective data center management. Register to watch the webinar recording or read on for just a few of the space and power capacity management KPIs hand-selected by our data center experts on the webinar.
Data Center KPIs to Optimize Capacity Utilization
Rack Units Fragmentation
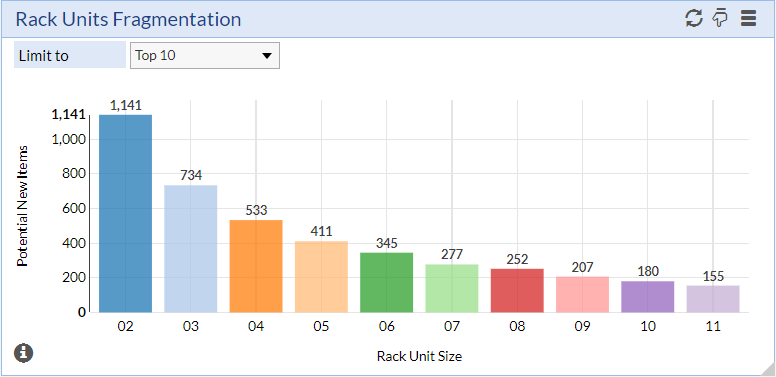
Rack units (RUs) fragmentation is one of Keena’s favorite metrics because it lets him see at a glance how many “big chunks of Us” are available to install items or how fragmented his data center may be. This chart shows the number of items that can be installed in a selected location if all the items had an RU height as indicated by the bar label along the x-axis. Each bar represents a specific RU size, and the y-axis lets you know how many assets can be installed of that size to fill it to capacity. As the size of the equipment increases, your capacity for it decreases. Ideally, you want the bar graphs to decline smoothly. Otherwise, as the equipment gets larger, you may run out of space because the space that you have is fragmented into smaller RUs.
“You may be looking at a gauge chart that tells you that you have so many rack units open, and you think you’re good,” said Nassoura. “But when you try to place large pieces of equipment, you may not have enough capacity.”
“As everyone knows, you never know the next piece of equipment that somebody’s going to say you have to house in your data center,” said Keena during the webinar. “Knowing how much contiguous space within a rack or within a series of racks you have is invaluable for your capacity planning going forward.”
Item Age in Months
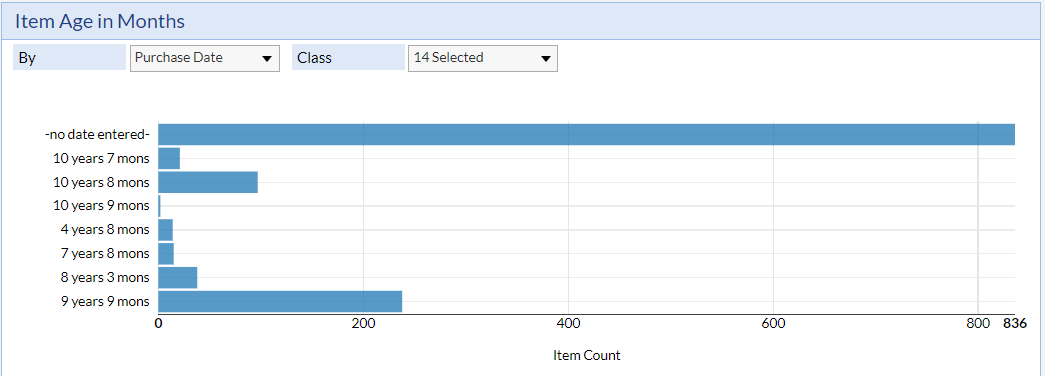
Knowing the age of the assets in your data center can help you determine how old your hardware is and when you should look to begin your next refresh cycle.
When interacting with the data, it’s helpful to be able to sort the data by the type of equipment you’re looking for—cabinet, PDU, data panel, device, or power outlet—and by purchase date, installation date, contract start and end dates, and other date-specific parameters. The ability to drill down to the details driving the chart enables you to slice and dice the data further by asset information like make and model or by more complex parameters like effective and potential power.
According to Keena, being able to drill down to the data makes it faster and easier to answer upper management’s questions. “If they want to know, ‘What’s the oldest piece of networking gear you have? Where is it located?’, being able to drill down through [the dcTrack interface] quickly gets you to that. You can get to it through other means, but we’ve found that being able to go to this dashboard and then drill down, we can quickly focus in and provide this information almost as quickly as the questions are asked.”
What-If Analysis
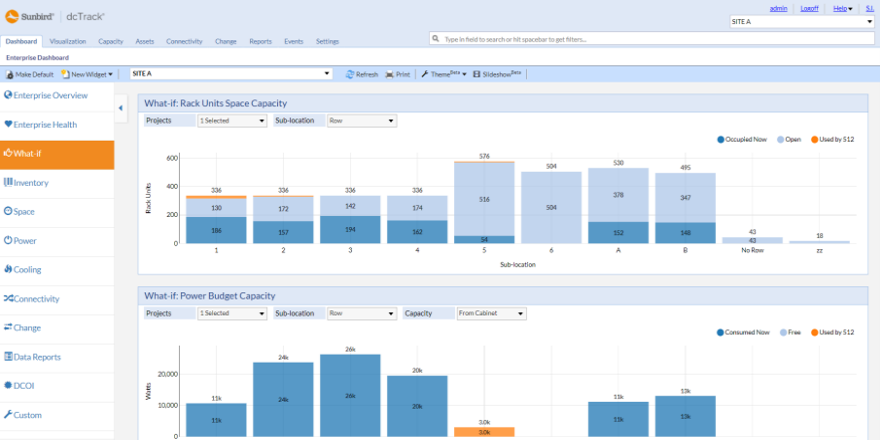
What-If analysis charts for space and power capacity can help you determine the net impact of additions and decommissions on your data center without impacting equipment in use. Conducting what-if analysis on a per-project basis gives you the flexibility to add the same equipment in different combinations and locations to multiple projects so you can better determine when you will run out of capacity and how long you can delay capital expenditures.
Keena plans to use what-if analysis more with upper management. “It provides that visual impact to them, where if you talk about rack Us or cabinets, it doesn’t have the same impact."
Power Capacity Trends
Multiple power capacity charts can be useful for identifying power consumption trends and for analysis to determine if any equipment is no longer working as intended. Using DCIM software to collect and analyze this data ensures greater accuracy since the actual readings are collected directly from the devices in your data center at your specified intervals.
A location’s total active power, for example, provides the facility’s total power consumption. Lines representing the minimum, maximum, and average combined with the ability to specify the time period—such as the previous hour, day, week, month, or year—at hourly, daily, or monthly granularity readings make it easy to identify spikes and other changes in power consumption.
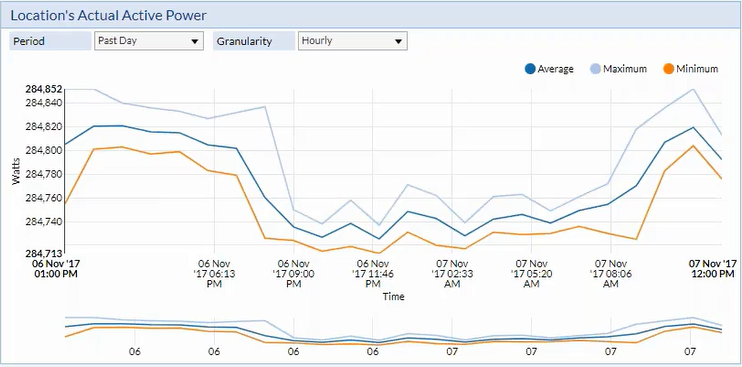
“Combined with the asset dashboard and the change management dashboard, we can quickly see whether we should have been expecting the change that happened either in the data center or down to the rack level,” said Keena during the webinar. “So, we can quickly isolate any power anomalies to the area and further investigate because sometimes you have equipment that just starts behaving differently than it’s behaved in the past. Sometimes that’s due to an increased workload on the piece of equipment, but sometimes it’s because that equipment is getting old and has a potential fault.”
Tracking the stranded power per cabinet, aisle, or row can help you better utilize your power capacity. Obtaining the stranded power metric is a simple matter of taking the difference between the budgeted value (the sum of all power consuming items' effective power within the specified location) and the actual value (all items using the average over the past hour at raw granularity).
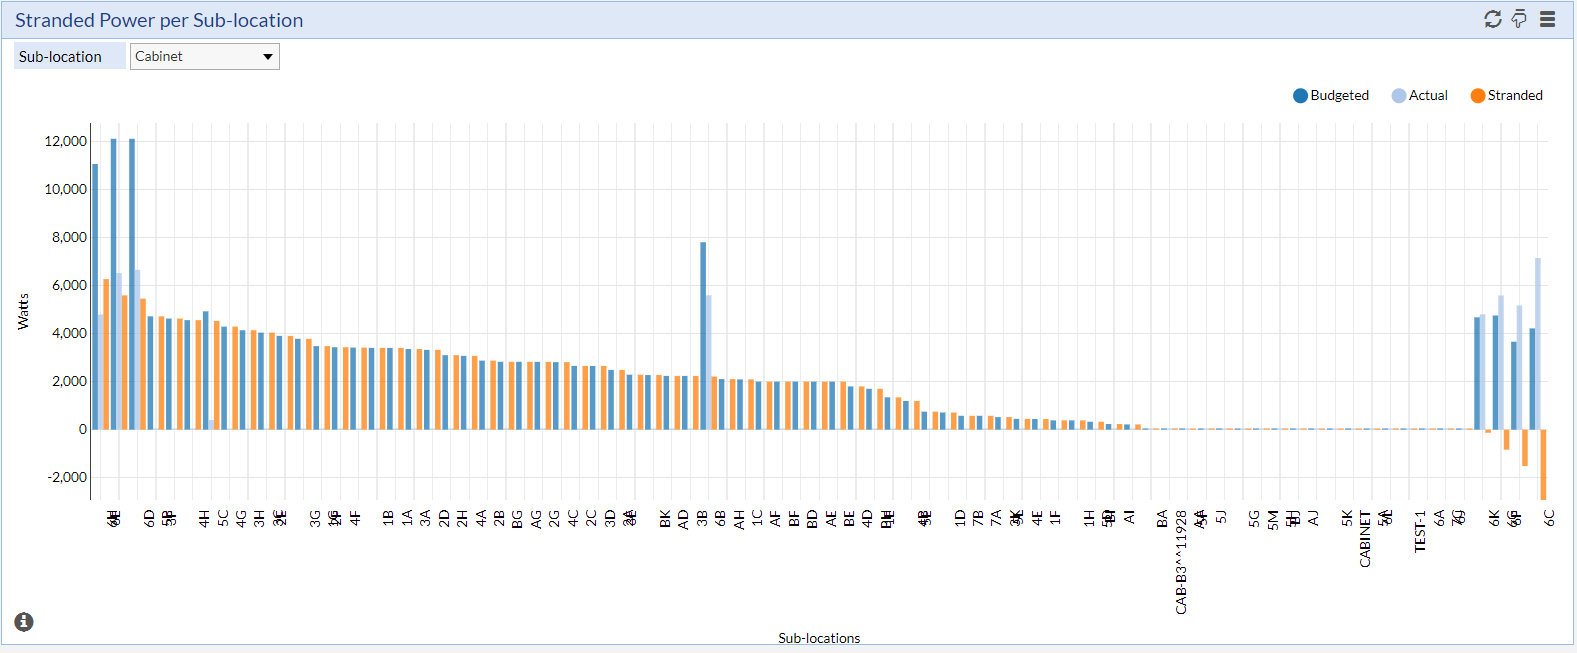
“If that difference is large, that would mean that you’re stranding a lot of power because the budget number is used for planning purposes and it’s reserving that much power from your infrastructure,” said Nassoura. “And if you’re not really using it, then you’re wasting that power and preventing yourself from adding additional equipment.”
On the flip side, it can also be dangerous if your actual power is greater than the budgeted value. According to Nassoura, having equipment draw more power than expected could lead to issues of oversubscribing the capacity of a cabinet and even having circuit breakers trip.
In his data centers, Keena also uses his stranded power charts to compare the budgeted power with the nameplate ratings provided by the manufacturer. Since these ratings tend to be rather generic, Keena often finds that the peak load is nowhere near what was recommended. “You try to get the budgeted a little bit above the peak load so you still account for the peak load when you need it, but you don’t strand as much power, and you can still go back and add the additional piece of equipment into that rack.”
Bringing It All Together
With data centers becoming increasingly data driven to improve the efficiency of space and capacity utilization, it’s more critical than ever for data center professionals to be able to integrate, analyze, and act on the KPIs that have the most impact for their organizations. Whether you are just starting to identify your data center management KPIs, looking to improve your current capacity utilization efforts, or planning your next data center projects, these tips and insights from data center experts can help you maximize the value of your DCIM data.
Want more ways to explore data center KPIs and improve your data center management today? Watch the webinar here, and then test drive Sunbird’s DCIM software for yourself today.